20 % Rabatt + 1 Prop Trading Konto gratis – Nur bei SabioTrade

Volume Profile Indicator

Use price and volume to maximise your trading profits

Quick analysis

Analyse the volume

Fair Value Area

MetaTrader platform

Normally: 199,00 €

Today: 49,00 €

What is the Volume Profile Indicator?

Imagine having a crystal-clear overview of where the market moves its largest volumes – the ability to see where the most important price levels are confirmed by actual trading volume.

That’s exactly what the Volume Profile Indicator does for you.

Picture this scenario: You open your chart, and instead of guessing where to enter or exit, you immediately see the key price zones where the largest trading volume occurred. This information provides insights into where the big market participants – institutional traders, hedge funds, the “big players” – are active.

With the Volume Profile Indicator, you have a tool that visualizes these key zones, allowing you to place your trades precisely in line with market activity.

And here’s the exciting part…

Once you start using the Volume Profile Indicator, you can:

✅ Determine precise entry and exit points based on actual trading volume, not just price movements.

✅ Identify crucial support and resistance zones with incredible accuracy by using High-Volume Nodes (HVNs) and Low-Volume Nodes (LVNs).

✅ Always trade in sync with the market trend by tracking the Point of Control (POC) and Value Areas – the price levels where most trading activities occur.

This means less guesswork and more confidence in your trading. You’ll always know exactly where you should take action.

Identify value areas

Identify value ranges and the fair value

A Value Area defines the price range that includes the Point of Control – the level with the highest volume and trading participation.

This allows traders to quickly determine the fair market value, supported by the majority of buyers and sellers.

Point of Control

The PoC indicates the level with the highest turnover.

The Point of Control (POC) is the price level where the most volume was traded, a critical indicator of market sentiment and potential reversal points.

The Volume Profile Indicator shows you the price levels with the highest trading volume over a specific period. These areas are crucial for placing your trades with much greater precision.

Volume Nodes

Use High Volume Nodes and Low Volume Nodes

Areas of increased trading (High Volume Nodes) indicate potential support and resistance levels, where trend movements often come to a halt.

In contrast, areas with low trading activity (Low Volume Nodes) mark regions that were quickly passed through in the past due to strong trends.

Application Scope

Application Scope of the Volume Profile Indicator

With the Volume Profile Indicator, you don’t rely solely on price movements – you trade based on the actual volume behind those movements.

It’s like having a secret insight into the structure of the market. You gain the critical insights that set professional traders apart from the masses.

Stop trading in the dark and start using the tool that professional traders trust to make well-informed decisions.

Normally: 199,00 €

Today: 49,00 €

The Advantages of Volume Profile

Follow the Big Money in the stock market and profit from it.

Targeted Trading

No more guesswork.

You can see where the "big money" is being traded by analyzing the volume distribution at different price levels. This gives you a huge advantage over traders who rely solely on price movements.

Multiple Timeframes

Ideal for All Timeframes

Whether on short-term intraday charts (like 5-minute or 10-minute) or on higher timeframes (like daily or weekly charts) – the Volume Profile Indicator can be precisely tailored to fit your strategy.

Work with volumes

Take out the emotions

No more rushed decisions driven by fear or greed. With precise volume-based data, you can make your trading decisions confidently and without emotions.

In trading, information is power – and volume is king.

While other traders rely solely on price movements and hope to guess the next market move, with the Volume Profile, you have the “roadmap” of the market in front of you. You can see where the big money is flowing.

Higher Profitability

Large institutions drive every market, so you can significantly increase your profitability by focusing on traded volume and following the big players.

DowHow Trader reviews

Our traders share their success stories.

Michael S

5/5

I have been trading for over 10 years, but the Volume Profile Indicator has taken my trading strategy to a completely new level. The ability to clearly identify High-Volume Nodes and Low-Volume Nodes has helped me make more precise decisions. I was especially impressed by the accuracy in identifying support and resistance zones. My trading is now much more confident and successful. I highly recommend this tool to any serious trader.

Anna L.

5/5

I’ve been searching for a tool that offers real insights into market structure for a long time, and the Volume Profile Indicator has exceeded all my expectations. Since I started using it, I can clearly see where the most volume has been traded and how the market behaves at these levels. It has revolutionized my trading plan. I find the feature that displays Value Areas particularly helpful – it’s like having a direct view into the trades of major market participants.

Daniel M

5/5

As someone who trades part-time, I often have little time to conduct lengthy market analyses. The Volume Profile Indicator has changed that for me. Now, with a quick glance, I can see where the important volume is and trade accordingly. It has not only helped me find better entry and exit points but also boosted my profits. A must-have for any trader looking to improve their performance!

Normally: 199,00 €

Today: 49,00 €

Questions

Frequently asked questions

The Volume Profile Indicator is an advanced charting tool that displays trading activity at specific price levels over a defined period of time. It plots the volume as a horizontal histogram on the chart, helping traders identify key price levels like the Point of Control (PoC) and the Value Area (VA). These price levels mark areas where the highest volume of trades has occurred, offering critical insights into support and resistance levels based on actual market participation.

The Volume Profile Indicator shows you where the most volume has been traded, which helps you identify price levels where many market participants are active. This gives you valuable insights into market dynamics, allowing you to determine high-probability entry and exit points. You can use this information to avoid emotional decisions and trade more confidently based on actual volume data.

Yes, the Volume Profile Indicator is highly flexible and can be used on all timeframes, from minute charts to monthly charts. You can adjust the number of candles (bars) to be used for the calculations, allowing you to customize the profile according to your preferred trading style and timeframe. Whether you are trading intraday or longer-term, the indicator will provide you with useful insights.

The Volume Profile Indicator offers a wide range of customization options to fit your needs. Some key parameters include:

  • PoC, PoH, PoL, and Value Area: You can choose to display the Point of Control (PoC) and the Value Area (VA) on the chart.
  • Timeframe adjustment: Set the number of bars (candles) used to calculate the profile for each timeframe (e.g., monthly, weekly, daily).
  • Color and position settings: Customize the colors of the Value Area and the profile, and decide whether you want the profile to be displayed on the right or left side of the chart. This flexibility allows you to configure the tool exactly how you want it.

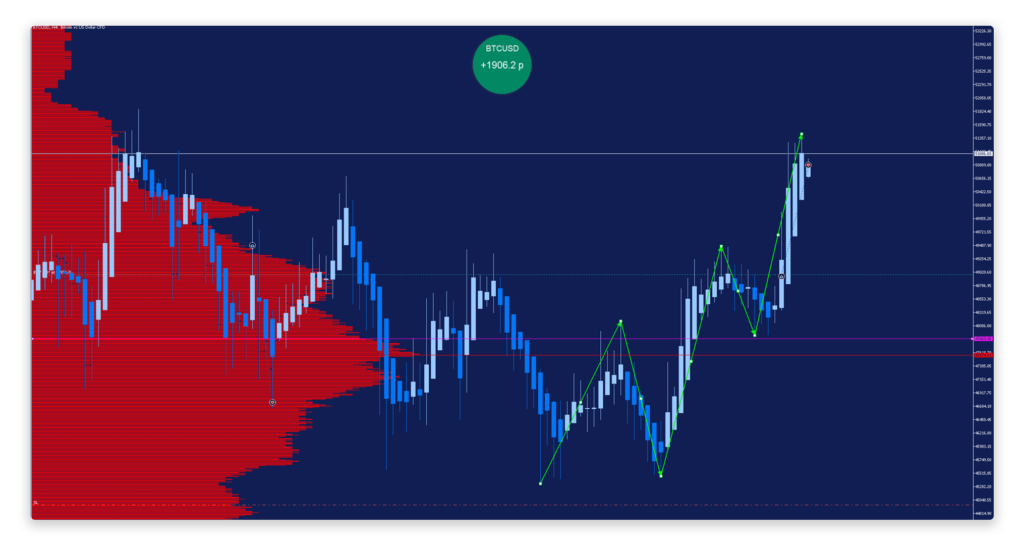
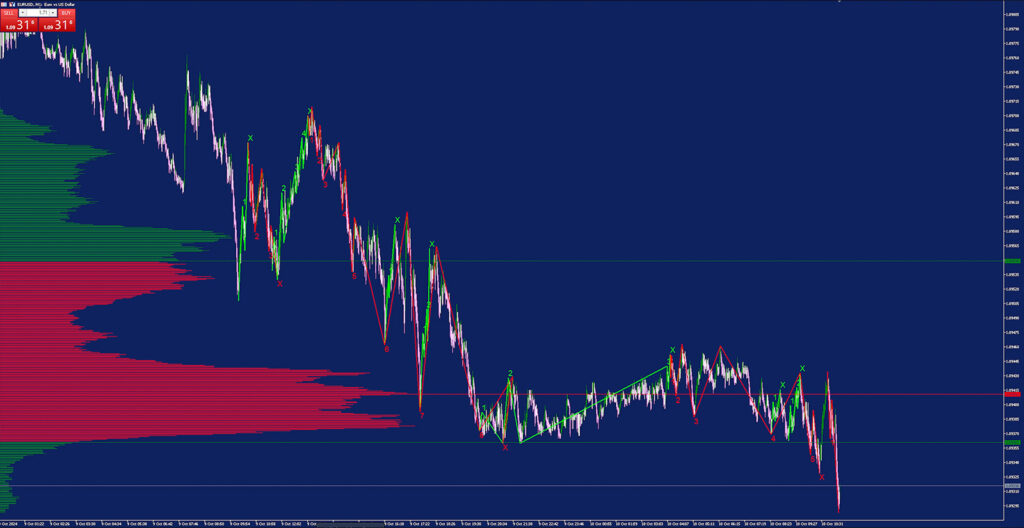
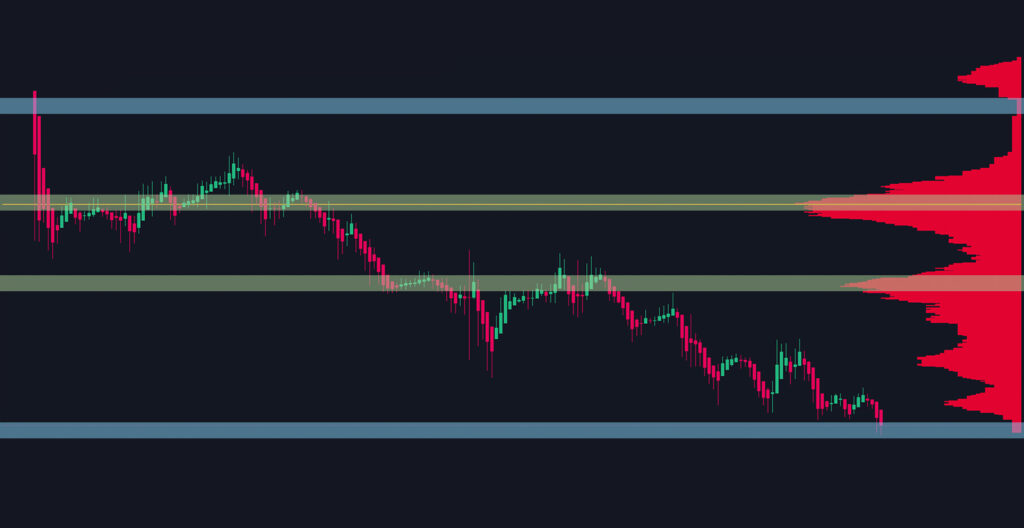
The Volume Profile Indicator can be used in a variety of markets, including stocks, futures, forex, CFDs, and many other financial instruments. The indicator works in any market where volume or tick data is available. It is especially useful in markets with representative trading volume, as it helps you identify key price levels based on trading activity. Whether you’re trading short-term (intraday) or long-term, the indicator provides valuable insights into market structure.