Fibonacci retracement is a key tool in technical analysis that helps traders identify potential levels of market trends
The Fibonacci Retracement is a popular tool in technical analysis that helps traders identify potential levels of a existing trend. It is based on the Fibonacci sequence, a series of numbers in which each number is the sum of the two preceding ones (e.g., 0, 1, 1, 2, 3, 5, 8, 13, etc.).
This mathematical concept finds application in many fields, including financial markets, where traders use key Fibonacci levels (such as 23.6%, 38.2%, 50%, 61.8%, and 78.6%) to predict potential price retracements during trends.
Trend Following is a strategy that focuses on capitalizing on the momentum of established market trends. Traders look for opportunities to ride the wave of a trend, either in an upward (bullish) or downward (bearish) direction. Fibonacci retracement levels can assist trend following traders by identifying possible pullbacks, which are temporary reversals within a larger trend.
When used together, Fibonacci Retracement levels provide trend-following traders with actionable insights for finding optimal entry points. The retracement levels help spot where price corrections may occur, allowing traders to enter the market at a favourable price before the trend resumes.
Understanding Fibonacci Retracement Levels
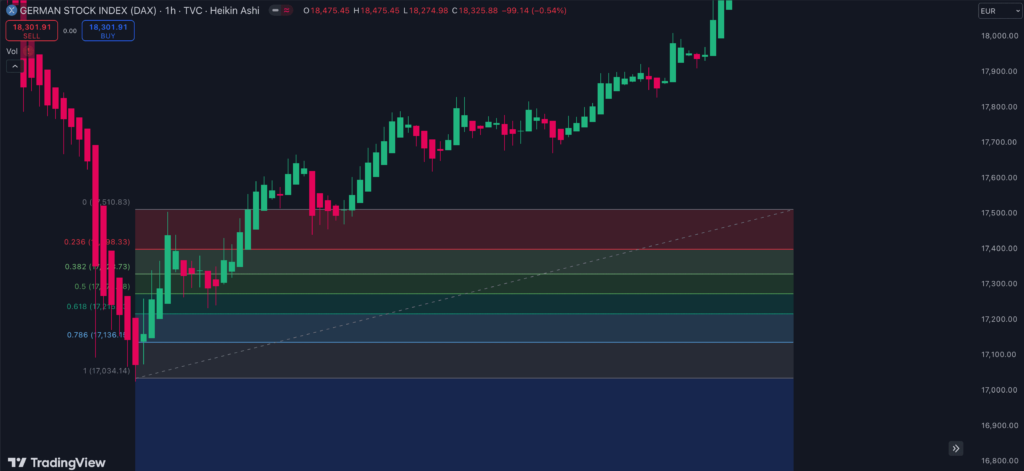
Fibonacci Retracement levels are horizontal lines drawn on a price chart to indicate potential levels during a market correction within a trend. These levels are based on the Fibonacci sequence and its associated ratios, which hold significance in both mathematics and nature. In trading, the most commonly used Fibonacci Retracement levels are 23.6%, 38.2%, 50%, 61.8%, and 78.6%. These percentages represent the likelihood of a price retracing before resuming its original direction.
The most commonly used Fibonacci Retracement levels are 38.2%, 50%, and 61.8%. My DowHow Strategy uses this key level in rule 3, that says: The correction of the trend must have run at least 38.2% in the second trend arm.
Fibonacci Retracement levels are drawn by identifying a major price move (either upward or downward) and selecting the high and low points of that movement. The retracement levels are plotted between these two points, providing traders with key zones to watch for potential reversals or continuation of the trend.
Fibonacci levels are significant because they reflect natural ratios that seem to resonate with market participants. Traders often place orders around these levels, which amplifies their importance as self-fulfilling support or resistance zones. The 61.8% level, in particular, is rooted in the “golden ratio” a concept that occurs frequently in nature and human behaviour, giving it added psychological weight in financial markets.
How Fibonacci Retracement Fits into Trend Following
Incorporating Fibonacci levels into a trend following strategy allows traders to identify potential entry and exit points during market corrections. The key idea behind trend following is to ride the momentum of a strong trend, whether upward or downward.
However, no trend moves in a straight line; markets often experience short-term pullbacks or rallies before continuing in the direction of the main trend. This is where Fibonacci Retracement levels play a critical role, helping traders spot these temporary price reversals, or retracements, and providing an opportunity to enter a trade in line with the broader trend.
In an uptrend, Fibonacci Retracement levels can help traders plan their entries during pullbacks. For example, as the price rises, it may experience a correction and retrace to a key Fibonacci level, such as 38.2% or 61.8%. At these levels, traders expect the price to find support and resume its upward movement, making it an ideal entry point to buy at a cheap price within a broader bullish trend.
Similarly, in a downtrend, traders use Fibonacci levels to identify rallies or temporary upward movements that present potential selling opportunities when the price retraces to a key level before continuing lower.
While Fibonacci Retracement levels offer a powerful tool for identifying potential entry points, many traders combine them with other technical indicators to increase the probability of success. For example, combining Fibonacci levels with moving averages, such as the 50-day or 200-day moving average, can provide additional confirmation that the retracement level is a good place to enter the trade.
Step-by-Step Guide: Using Fibonacci Retracement in a Trend Following Strategy
Using Fibonacci Retracement in a trend-following strategy is a practical way to identify potential trade setups, offering precise entry and exit points. Here’s a step-by-step guide on how to effectively apply Fibonacci Retracement to real trades.
Step 1: Identifying a strong valid trend in the market
Before applying the Fibonacci Retracement, it’s essential to identify a clear, strong trend. Whether the market is moving upward or downward, look for consistent price action that indicates a clear direction. Trends can be identified by using the craft of trend drawing. Once a solid trend is established, you can move on to applying Fibonacci retracement levels.
Step 2: Use the Fibonacci Retracement
In an uptrend, take the Fibonacci Retracement from the most recent low (the lowest point before the uptrend began) to the highest high (the highest point reached). In a downtrend, reverse the process, drawing the retracement from the trend high to the trend low. This will automatically generate horizontal lines representing the key Fibonacci levels (23.6%, 38.2%, 50%, 61.8%, and 78.6%) across your price chart.
These levels indicate where the price might retrace before resuming the original trend.
Step 3: Identifying Key Retracement Levels
Once the Fibonacci levels are plotted, identify the key retracement levels that could act as potential support in an uptrend or resistance in a downtrend. The most commonly watched levels are 38.2%, 50%, and 61.8%. These areas provide opportunities to enter the trade in the direction of the trend. For example, in an uptrend, you might place a buy order at the 38.2% retracement level, anticipating the price will resume its upward trajectory.
Step 4: Confirming with Additional Indicators
To improve the accuracy of your trades, it’s essential to confirm the retracement levels with additional indicators. Tools like the Moving Average Convergence Divergence (MACD), Relative Strength Index (RSI), or volume indicators can provide insights into market momentum and signal whether the retracement is likely to hold or break. If, for instance, the RSI indicates an oversold condition at the 61.8% retracement level, it can serve as an additional confirmation that the trend is ready to resume, increasing your confidence in entering the trade.
Step 5: Setting Stop-Loss and Take-Profit Levels
Finally, use Fibonacci projections to manage risk and determine exit points. Place stop-loss orders slightly below the identified retracement level (in an uptrend) or above it (in a downtrend) to protect against the possibility of the trend reversing. Take-profit levels can be set based on Fibonacci extension levels, such as the 100%, 161.8%, or 200% projections of the original price movement. This ensures that you lock in profits as the trend progresses, while also managing your risk effectively.
By following these steps and combining Fibonacci retracement with other technical tools, you can create a disciplined and effective trend-following strategy tailored to various market conditions.

Common Mistakes to avoid when using Fibonacci Retracement
While Fibonacci Retracement is a powerful tool for trend following strategies, traders often fall into common traps that reduce its effectiveness. One of the biggest mistakes is blindly following Fibonacci levels without confirming the strength of the trend.
Fibonacci Retracement is most reliable when used in conjunction with a clear, established trend. Without proper confirmation, traders might enter positions based solely on retracement levels, only to find that the trend has weakened or reversed entirely.
Another common error is relying solely on Fibonacci without considering using a proper trading strategy.
Traders also frequently over-complicate their analysis by using Fibonacci on multiple time frames without understanding the relevance of using one timeframe only.
Additionally, traders often misidentify the trend when using Fibonacci Retracements. Incorrectly identifying the trend high or low can distort the retracement levels and lead to poor trade setups. It’s crucial to avoid combining Fibonacci with indicators that conflict with its signals, as this can create confusion and reduce the accuracy of your analysis.
Conclusion: Integrating Fibonacci into Your Trend Following Strategy
Fibonacci Retracement is a valuable tool for identifying key entry and exit points in trend-following strategies. However, it’s essential to practice using Fibonacci Retracement in a demo account before applying it in live trading, ensuring a solid understanding of its application.
Successful trading requires not just technical analysis, but also strong risk management. Setting proper stop losses and take-profits, while staying aware of broader market conditions, can help traders integrate Fibonacci retracement into a well-rounded, disciplined strategy.
FREE 3-day online event, “30 Fibonacci & Elliott Wave Trading Strategies,“ running from September 10th to 12th
We want to invite you to an exclusive 3 Day Fibonacci & Elliott Wave event on September 10th-12th from 10AM to 8PM ET organized by our friends at timingresearch.com.
Save your seat completely free.
Trading experts share their knowledge with you!
Day 1 (9/10/24, Tuesday): Anka Metcalf, Norman Hallett, Michael Filighera & Sascha Gohring, Jody Samuels, John Thomas, Jeff Tompkins, Harry Boxer, Toni Hansen
Day 2 (9/11/24, Wednesday): Todd Gordon, Matt Timpane, Doc Severson, Alla Peters-Plocher, Avi Gilburt
Day 3 (9/12/24, Thursday): Aldo Lagrutta, Sid Norris, Ahren Stephens, Casey Stubbs, Tim Racette, Wally Olopade, The Option Professor
Reserve your spot to discover how to trade the markets with Fibonacci & Elliott Wave strategies.
Why Attend?
• Exclusive Insights: Gain knowledge from 30 trading experts, each sharing their top Fibonacci & Elliott Wave strategies.
• Diverse Perspectives: Explore a wide range of techniques.
• Actionable Strategies: Walk away with practical strategies you can implement immediately.
• Interactive Sessions: Engage with presenters, get your questions answered.
Whether you’re a seasoned trader or just starting out, this event is designed to provide you with the tools and strategies to enhance your trading performance. Don’t miss this unique opportunity to learn from the best and stay ahead of the market.
How often do you have the chance to get face to face with the big players who know what they are doing in the market…
RARELY…
Be sure to bring paper and pen to take notes – we are going to share a lot of information.
Can’t make it to the live 3 Day Mega event? No worries –