

Discover the art of identifying and utilizing trends – your key to success in trend trading.
Welcome to the second day of our 7-Days Trading Challenge! I hope you found yesterday’s lesson helpful and had the opportunity to work on the small assignment. Now you are well-informed about how prices are formed on the stock market, an important piece of knowledge that forms the basis of your trading craft.
Today, we dive into one of the most central and exciting topics in trend trading: the trend itself.
What exactly do we understand by a trend? How can we identify a trend, and how do I work as a trend trader? These questions are crucial because the ability to identify and correctly interpret trends is one of the fundamental prerequisites for long-term success in the markets.
In today’s session, we will address these questions. I will show you how we work as trend traders. You will learn how to interpret market signals and how to profit from movements in the financial markets.
Look forward to another insightful lesson full of valuable insights and tips to improve your trading.

Markets move in recurring trends
Charles Henry Dow, a pioneer in the financial world, not only co-founded the Wall Street Journal and created the first US stock index, the Dow Jones Industrial Average, but also laid the foundations for technical analysis.
His observations and theories, made at the end of the 19th and beginning of the 20th century, continue to have a profound impact on how we understand and analyze markets today.
Dow recognized that stock prices do not move solely based on fundamental data or company news but also follow long-term trends. This insight was revolutionary as it completely changed the way investors and analysts view market movements.
Through his meticulous chart analysis, Dow identified patterns indicating that markets move in recurring trends – a principle that still forms the basis of technical analysis today.
The so-called Dow Theory, named after Charles Dow, encompasses a series of principles explaining market dynamics. It is based on the assumption that all market-relevant information is reflected in prices and that these prices move in trends.
Dow’s work suggests that trend traders do not need to predict the market. Instead, it is about recognizing and utilizing existing trends.
This insight frees traders from the burden of having to predict every single market movement. Instead, it allows them to focus on identifying and trading long-term trends.
Although the Dow Theory has been around for so long, it still forms the foundation of many trading strategies and is the basis of my DowHow Strategy.
It teaches us that we must recognize patterns and trends to make informed and strategic trading decisions.
Markets may change over time, technology may advance, but the fundamental principles discovered by Dow remain constant:
Markets move in trends, and if you understand these trends, you can be very successful as a trader.
Different types of trends: uptrend, downtrend, no trend
Trend trading is one of the most fundamental and powerful strategies in any trader’s arsenal. Combined with technical analysis, it leverages the general direction of the market in the form of trends.
We generally distinguish between two main types of trends: the uptrend and the downtrend.
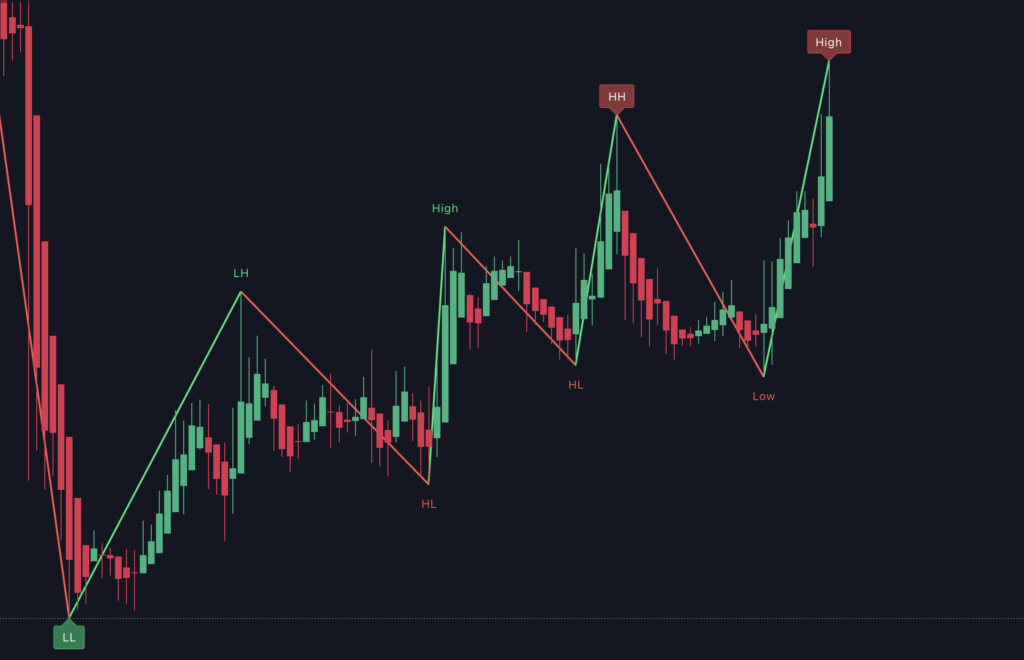
An uptrend is characterized by the market continuously reaching higher lows (higher lows) and higher highs (higher highs). This signals increasing demand and an excess of buyers in the market, causing the value of the asset to rise. Traders who enter long positions during this phase are betting on further price increases and a continuing uptrend.
In contrast, a downtrend is characterized by falling prices, where the market forms lower highs (lower highs) and lower lows (lower lows). This indicates an excess of sellers and decreasing demand, causing the asset’s value to fall. Traders who expect this trend to continue can enter short positions to bet on further price declines.
In addition to these two clear trend types, there are phases where the market appears to be without a recognizable trend. This often happens after an existing trend has been broken and no new trend has yet formed according to our rules.
These phases of uncertainty or consolidation are characterized by sideways price movements and can be challenging for traders but also offer opportunities. In such times, it is particularly important to be patient and wait for clear signals of a new trend before entering a position.
Understanding these different types of trends and the ability to identify them in real-time is crucial for success in trend trading.
It requires careful analysis of price movements and trading volume to make reliable predictions about the future market direction. By learning to recognize these trends and use them strategically, you can increase your chances of profitable trades.
In practice, this means that successful trend traders not only understand the current market movements but also have the patience and discipline to wait for the right moments to enter or exit.
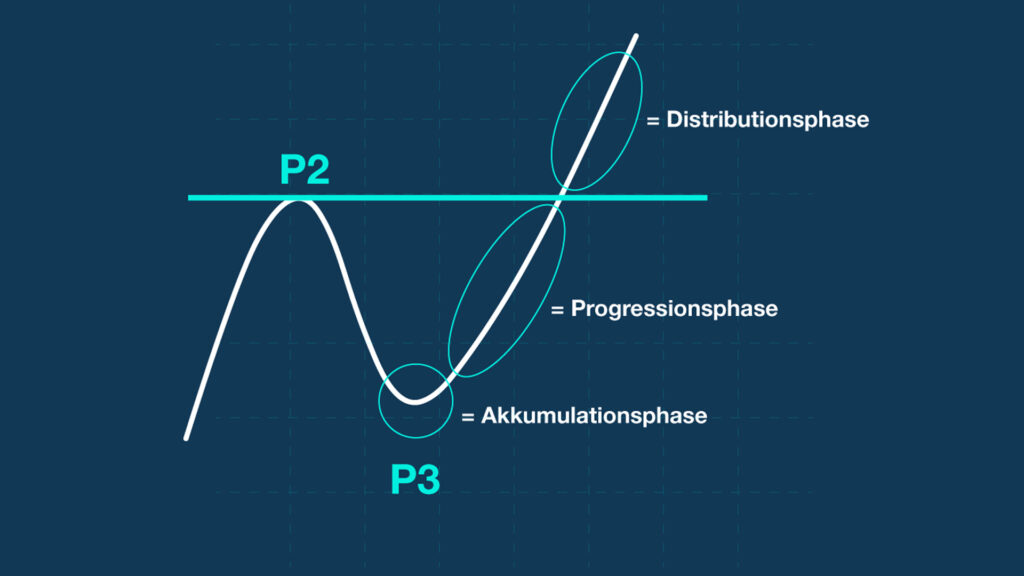
Trends develop in three major phases
Trends typically develop in three major phases, providing a fascinating insight into the psychology and behavior of market participants. Understanding these phases is crucial for any trader intending to use market dynamics to their advantage.
Accumulation Phase: This phase marks the beginning of a new trend, often following a period of uncertainty or a previous downtrend. The average trader may still hesitate at this point, but experienced traders and so-called “smart money” investors begin to take positions.
They recognize the market’s potential before a significant trend reversal becomes apparent. Their purchases are often the result of thorough analysis and a deep understanding of market conditions, giving them a decisive advantage.
Progression Phase: Once the trend solidifies and the first gains become visible, the media begins reporting on the rising prices. This phase attracts a broader group of investors and traders drawn by the positive news.
The increasing attention and higher trading volume drive prices further up. For many, this phase presents the ideal opportunity to benefit from the continuous upward movement.
Acceleration Phase: In this final phase, public enthusiasm reaches its peak. The market is at a high, and the reporting is predominantly positive, often leading to an euphoric mood.
Experienced investors and traders who entered early begin to realize their profits and exit the market. This phase can be risky as it is near the point where the trend could reverse.
Each of these phases offers different opportunities and risks. Successful traders learn to recognize the signs of these phases and adjust their strategies accordingly to make the most of market movements.
How do I recognize a trend?
Trend following is a trading strategy based on recognizing and following existing market trends. Instead of trying to “beat” the market or precisely determine the best entry and exit points, trend following is about moving with the trend.
Traders who follow the trend strategy are always looking for clear signals indicating the start of a new trend, aiming to profit from this trend for as long as possible until it becomes clear that the trend has ended.
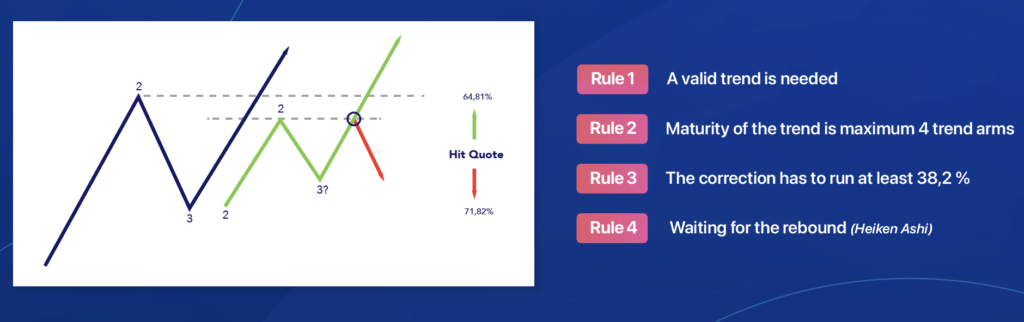
💡 Rule 1 of my DowHow Strategy is: There must be a valid trend.
A valid trend requires a recognizable movement, a correction of this movement, and a subsequent further movement. When we are in a valid trend, we are already in the second trend leg.
This means that the market is not only moving in a clear direction over a longer period but also closing above point 2 in your timeframe. The closing price is crucial here as it confirms the strength and sustainability of the trend.
The trend emerges because the price is driven up by the volume at this point. If you remember our example from yesterday, we had an opening price of €88, and due to the volume, the closing price rose to €100 beyond our point 2.
If the price closes below our P2, for example, because it only made a spike but did not close there, we do not have a valid trend.
How do I identify the trend? Through trend drawing
Mastering trend drawing is essential for every trend trader. It allows you to determine at any time whether there is a valid trend and in which direction it is moving. This skill is crucial for successfully navigating the market.
My mentor taught me how important it is to master trend drawing. I practiced trend drawing until I could identify a trend within just 10 seconds.
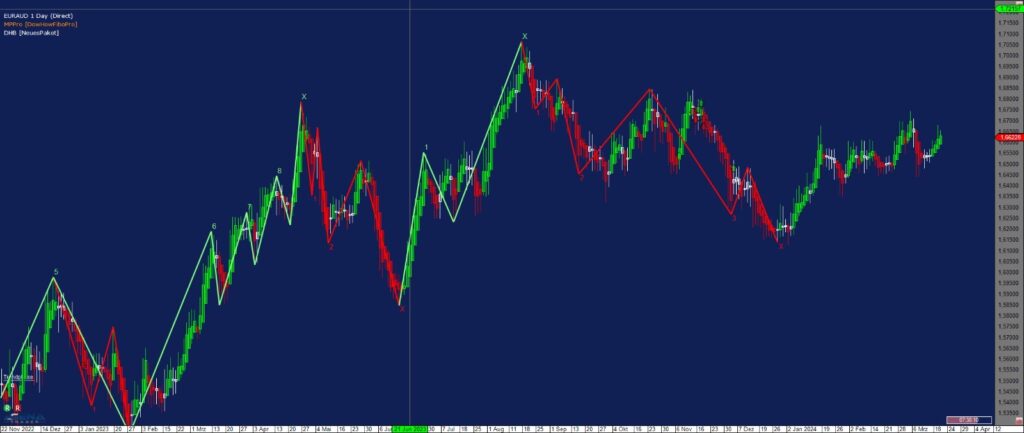
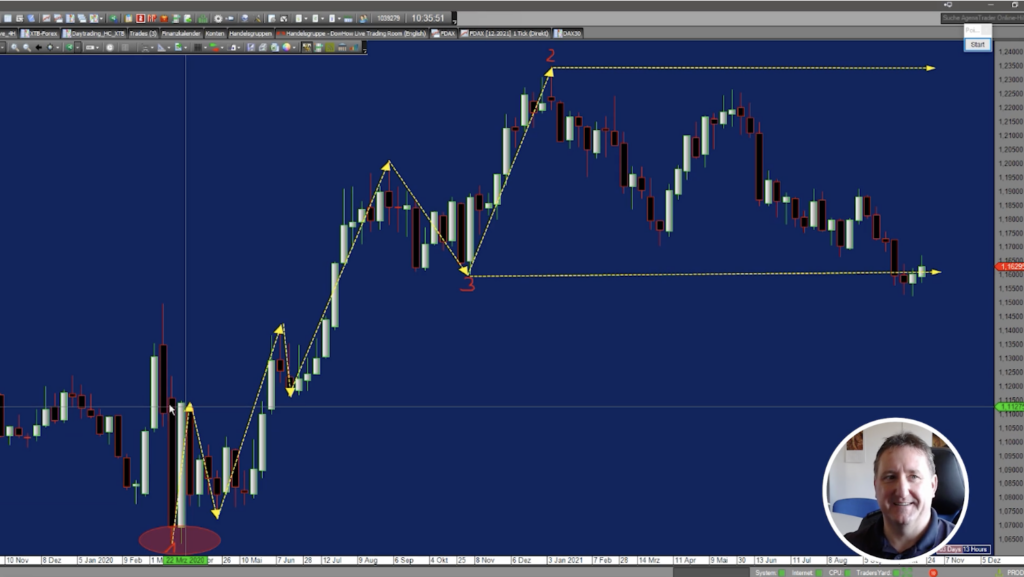
In this example from my training Trading with Logic, we start at the absolute low point and draw the first movement to the initial highest high point. This marks our initial movement and serves as the starting point from which we continue drawing the trend.
How exactly trend drawing works is taught in detail in my training Trading with Logic.
The art of trend drawing is not only a technical tool but a skill that requires deep understanding and intuition for market movements. In my training, this competence is detailed and extensively practiced.
The ability to quickly and accurately identify a trend enables you to make decisions based on solid, technically sound foundations rather than assumptions or emotional reactions.
The importance of this technique cannot be overstated. It forms the basis for recognizing when the market is moving in a clear direction and when it is time to act based on these insights.
This essential skill is a central component of my education and a key to your success as a trend trader.
Now it’s your turn: your homework
If you haven’t fully mastered trend drawing yet or are hearing about it for the first time today, I recommend using an indicator in TradingView for today’s task. This step is to provide you with visual support, helping you better assess whether there is currently a trend and in which direction it is moving.
Assignment:
1. Choose a Financial Instrument: Start with a market or security of your choice and open the corresponding chart.
2. Open TradingView: If you don’t have an account yet, you can register for free. TradingView offers a variety of indicators that help you visualize and roughly depict trends.

3. Activate the Indicator: Go to indicators in TradingView. Select Technical Analysis and look for high, low indicators. These will show you the trend.
4. Observe Trends: These indicators are not always accurate but are a good starting help or way to learn trend drawing.
5. Select Different Values: Now you can take different values and let the tool analyze them.
This exercise aims to help you develop a better feel for trend analysis and show you how technical indicators can be used as tools to identify market trends. It is an important step in putting theory into practice and deepening your understanding of market movements.
Have fun with it. See you tomorrow for the third day of our challenge.
Until tomorrow
Markus


2 Responses
Hi Markus
Thanks for the information being sent. Even though they are revision materials for me, I’ve been through them including the exercises. I can easily spot a trend but also use EMAs to assist with analysis.
Hey Rackelle,
thanks for your feedback. Good luck for your trading 🙂